Q1 2024 Miami Dade County, FL

Industrial Market Overview

Miami’s industrial market has seen a slowdown in net absorption, dropping to 1.9 million SF over the past year, below the prepandemic average of 3.1 million SF. This decline is attributed to the departure of transportation tenants, leading to a rise in vacancies to 3.4%. Despite this, Miami’s market conditions remain tight, with vacancies well below the national average. Landlords have taken advantage of this by increasing rents by 6.4% annually. Despite the recent moderation in rent growth, Miami continues to be a crucial logistics hub, attracting demand from importers and exporters due to its international connections. The Everglades’ barrier limits new development, ensuring vacancies remain low. Sales volume has returned to pre-pandemic levels, indicating ongoing investor confidence.

Market indicators

Miami industrial market vacancy rate indicator

Vacancy Rate

3.4%

Icon representing an individual industrial submarket area in Miami commercial real estate

12 Mo Net Absorption SF

2M

Industrial properties under construction square footage icon

Under Construction SF

6.4M

Industrial market rent NNN per square foot indicator

Market Rent Price NNN / PSF

$20.20

Industrial property sale price per square foot icon

Market Sale Price / PSF

$251.88

Total industrial inventory square footage across Miami submarkets

Total Inventory SF

273M

Market indicators

Miami-Dade County saw population growth rebound after a two-year decline, yet remains 37,000 residents short of 2019 levels due to pandemic-induced international travel restrictions and rising living costs. Despite a net loss of lower-income residents, the area attracted high-net-worth individuals, injecting $6.4 billion into the economy. Home values surged by 71%, outpacing national and state averages, making homeownership increasingly challenging for average earners. However, rising wealth drove a 47% increase in household buying power and an 11% growth in real retail sales by December 2023. Job growth exceeded the national rate, with office sectors showing resilience, attracting major firms and forecasting continued growth.
Demographic Overview
Demographic Category Metro US
Population 2,707,350 335,498,625
Households 988,110 131,032,500
Median Households Income $70,017 $77,149
Labor Force 1,393,656 169,031,172
Unemployment 1.8% 3.8%

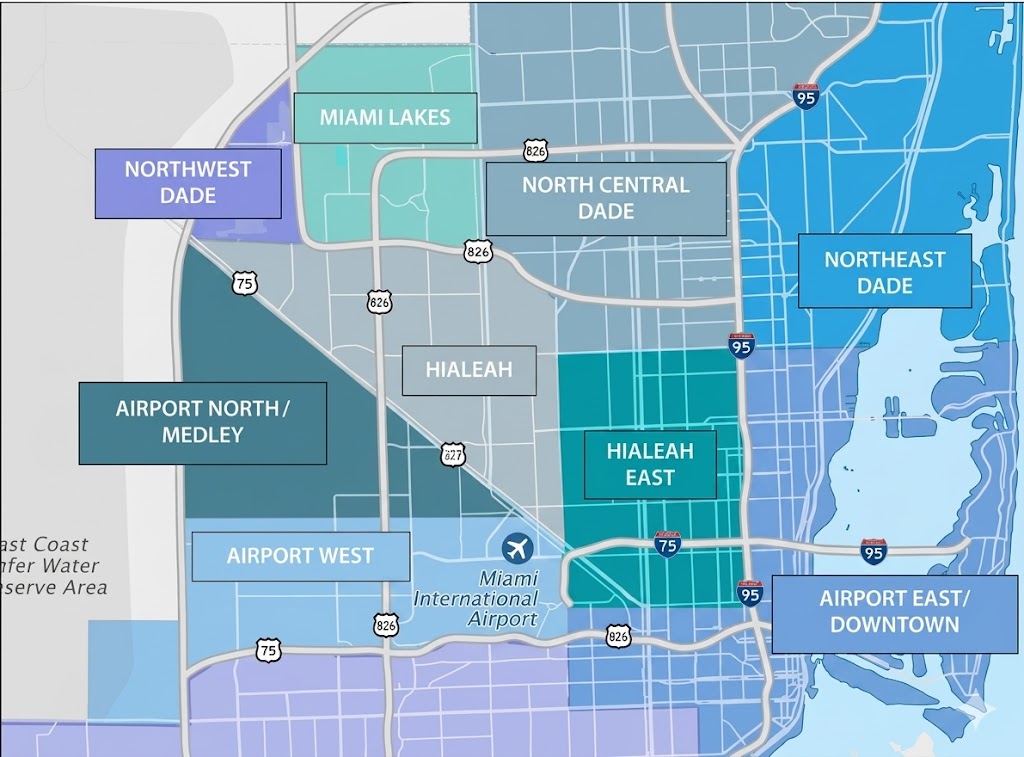
Notable Submarkets - Statistical Data

Notable Submarkets - Statistical Data
Bldgs SF (000) Market % Under Construction SF (000) Market Rent NNN / PSF Vacancy %
Miami Airport West 1,191 49,212 18.0% 1,241 $22.75 4.4%
Miami Airport East 528 22,349 8.2% - $20.79 2.4%
N. Miami Beach 1,129 42,588 15.6% 1,718 $17.96 3.3%
Medley 988 41,886 15.3% 817 $18.89 3.1%
Hialeah 1,674 31,643 11.6% - $14.81 2.7%
Notable Lease Transactions
Notable Lease Transactions Size SF Tenant Deal Type
3761 W 112 Pl, Hialeah, FL 178,201 MDTurbines New Lease
10800 NW 103rd St, Medley, FL 146,018 Winco Renewal
9251 NW 112th Ave, Medley, FL 84,741 Ocean Doors & Windows New Lease
Notable Sales Transactions
Notable Sales Transactions Size SF Buyer Sale Price
2800 NW 39th Ave, Miami, FL 198,500 Miami-Dade County $45,000,000 ($227 PSF)
7290 NW 77th Ct, Miami, FL 143,571 Parker Davis HVAC Intl $42,350,000 ($295 PSF)
3605-3615 NW 115th Ave, Miami, FL 50,000 EQT Exeter $14,500,000 ($290 PSF)

Source: Costar.com. The information contained within this report is believed to be reliable. The information may contain errors or omissions and is presented without any warranty or representations as to its accuracy.