Q1 2025 Miami Dade County, FL

Industrial Market Overview

Miami’s industrial market has slowed, with net absorption dropping to -2.0 million SF, well below the pre-pandemic average. Large tenants like UFP Industries and USPS have vacated spaces, pushing the vacancy rate up to 5.7% in Q1 2025, though still below the U.S. average of 6.9%. Despite 5.1 million SF under construction, modern logistics space remains scarce, with properties built from 2015-2023 97% leased locally. Rent growth has slowed to 3.4% in the past year, down from 16% in 2022, and is expected to moderate further. Miami’s strategic position as a logistics hub, with top ports and airports, drives demand. Limited development due to geographic constraints keeps vacancy rates low, with rent growth likely to reaccelerate in 2026. Despite rising interest rates, sales activity picked up late last year, with major acquisitions by prominent buyers.

Market indicators

Miami industrial market vacancy rate indicator

Vacancy Rate

5.7%

Icon representing an individual industrial submarket area in Miami commercial real estate

12 Mo Net Absorption SF

-2M

Industrial properties under construction square footage icon

Under Construction SF

5.1M

Industrial market rent NNN per square foot indicator

Market Rent Price NNN / PSF

$20.91

Industrial property sale price per square foot icon

Market Sale Price / PSF

$246

Total industrial inventory square footage across Miami submarkets

Total Inventory SF

276M

Market indicators

From 2020 to 2022, Miami-Dade saw a $9.5 billion influx of wealth, driven by high-income residents moving from the Northeast and West and strong job growth in high-paying sectors. This boosted consumption but also raised living costs, particularly in housing, with home prices up 60% and rents rising sharply. While housing cost growth has slowed, affordability remains a concern, with 50% of households below the ALICE threshold. The region needs 116,000 affordable units by 2030, but progress has been slow due to local resistance. Despite this, Miami continues to attract high-paying firms, ensuring ongoing wealthier household inflows.
Demographic Overview
Demographic Category Metro US
Population 2,721,700 337,665,188
Households 1,000,780 132,688,781
Median Households Income $72,469 $80,376
Labor Force 1,408,447 168,843,266
Unemployment 2.5% 4.2%

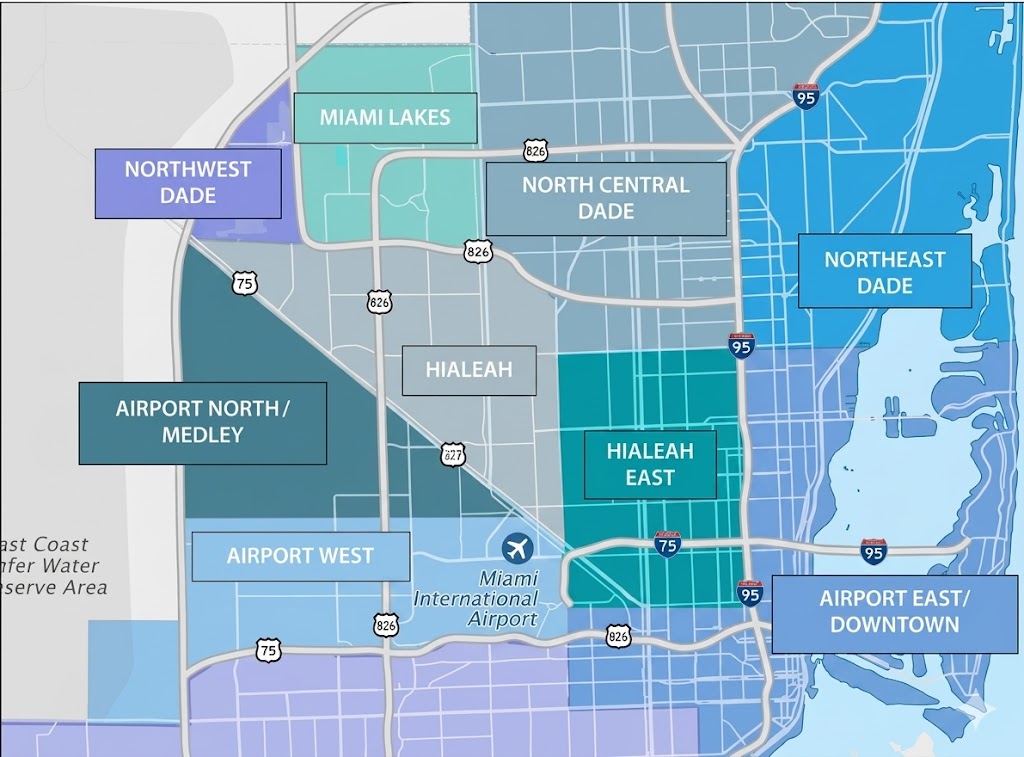
Notable Submarkets - Statistical Data

Notable Submarkets - Statistical Data
Bldgs SF (000) Market % Under Construction SF (000) Market Rent NNN / PSF Vacancy %
Miami Airport West 1,206 48,520 17.5% 2,725 $23.77 4.9%
Miami Airport East 534 22,597 8.2% - $21.45 3.7%
N. Miami Beach 1,138 44,252 16.0% 1,104 $18.47 8.2%
Medley 996 41,375 15.0% 725 $19.32 6.6%
Hialeah 1,687 31,819 11.5% - $15.52 4.3%
Notable Lease Transactions
Notable Lease Transactions Size SF Tenant Deal Type
5671 NW 72nd Ave, Miami, FL 364,608 CEVA Logistics Renewal
1350 NW 129th Ave, Doral, FL 134,200 Kuehne+Nagel Renewal
7000 NW 32nd Ave, Hialeah, FL 102,446 Boise Kascade New Lease
Notable Sales Transactions
Notable Sales Transactions Size SF Buyer Sale Price
2323 NW 72nd Ave, Doral, FL 77,607 IP Capital Partners $28,000,000 ($360 PSF)
5101 NW 37th Ave, Miami, FL 72,886 Longpoint Realty $10,700,000 ($146 PSF)
9051 NW 97th Ter, Miami, FL 35,000 Shauna Godbolt $8,400,000 ($240 PSF)

Source: Costar.com. The information contained within this report is believed to be reliable. The information may contain errors or omissions and is presented without any warranty or representations as to its accuracy.