
Q2 2026 Miami Dade County, FL

Industrial Market Overview

Miami remains one of the nation’s most important industrial markets, supported by its role as a major logistics and trade gateway through Miami International Airport, PortMiami, and South Florida’s transportation network. Demand continues to be driven by logistics, freight forwarding, construction, and light manufacturing users.

Market conditions have softened as new supply outpaces demand. Vacancy has risen to 8.0% from 6.7% a year ago, while annual rent growth has moderated to 1.5%. Despite recent negative absorption, long-term fundamentals remain strong, supported by limited land availability, continued population growth, and Miami’s strategic position in global trade. Looking ahead, the market is expected to remain competitive as new deliveries continue, though demand for well-located industrial space should remain healthy.

Market indicators

Miami industrial market vacancy rate indicator

Vacancy Rate

8.0%

Icon representing an individual industrial submarket area in Miami commercial real estate

12 Mo Net Absorption SF

-1.3M

Industrial properties under construction square footage icon

Under Construction SF

3.9M

Industrial market rent NNN per square foot indicator

Market Rent Price NNN / PSF

$20.75

Industrial property sale price per square foot icon

Market Sale Price / PSF

$204

Total industrial inventory square footage across Miami submarkets

Total Inventory SF

285M

Market indicators

Miami is home to approximately 2.85 million residents and 1.3 million jobs, supported by a diverse economy driven by international trade, finance, tourism, healthcare, and logistics. The region’s economy grew 3.3% over the past year, while employment increased 1.3%, both outperforming many major U.S. metros. Miami continues to benefit from strong business investment and its role as a global gateway through PortMiami and Miami International Airport. With unemployment at 2.8%, well below the national average of 4.4%, the metro remains one of the country’s strongest economic performers. Long-term growth prospects remain favorable, supported by Miami’s international connectivity, diversified economy, and continued appeal to businesses and residents alike.
Demographic Overview
Demographic Category Metro US
Population 2,831,965 342,359,094
Households Median 1,005,841 134,387,406
Households Income $79,132 $84,800
Labor Force 1,438,716 170,466,453
Unemployment 2.9% 4.5%

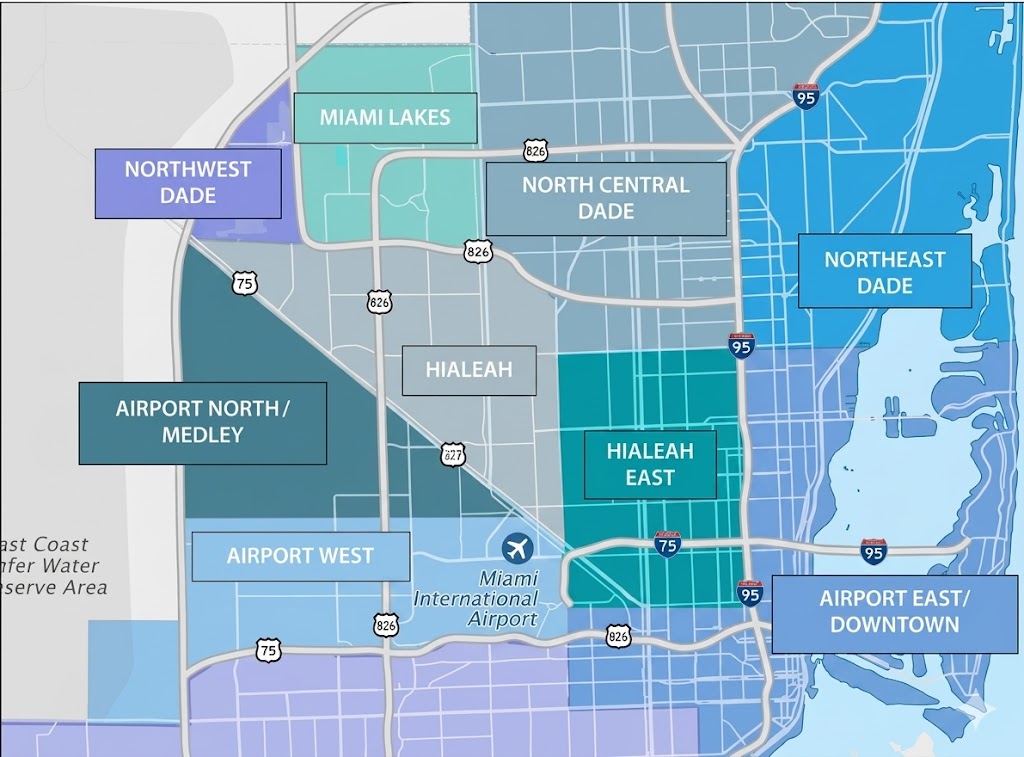
Notable Submarkets - Statistical Data

Notable Submarkets - Statistical Data
Bldgs SF (000) Market % Under Construction SF (000) Market Rent NNN / PSF Vacancy %
Miami Airport West 1,198 50,278 17.7% 1,554 $23.52 9.3%
Miami Airport East 535 24,668 8.7% 139 $22.00 8.7%
N. Miami Beach 1,137 44,990 15.9% 1,081 $18.45 11.6%
Medley 997 41,969 14.8% 541 $19.59 9.3%
Hialeah 1,682 31,505 11.1% 69 $16.14 5.6%
Notable Lease Transactions
Notable Lease Transactions Size SF Tenant Deal Type
3201 NW 110th St, Miami, FL 172,288 Captiva Containers New Lease
4141 W 91st Pl, Hialeah, FL 190,351 CompletePet Florida LLC New Lease
11700 NW 100th Rd, Medley, FL 139,105 PrimeSource Building Products Renewal
Notable Sales Transactions
Notable Sales Transactions Size SF Buyer Sale Price
9500 NW 108th Ave, Medley, FL 200,000 Seagis Property Group $48.8 MIL (244 PSF)
1800 NW 70th Ave, Miami, FL 68,132 Miami Dade County $19.1 MIL (281 PSF)
1600 NW 165th St, Miami, FL 65,337 O'Connor Capital Partners $17 MIL (260 PSF)

Source: Costar.com. The information contained within this report is believed to be reliable. The information may contain errors or omissions and is presented without any warranty or representations as to its accuracy.