
Q3 2025 Miami Dade County, FL

Industrial Market Overview

Miami’s industrial market is slowing. Net absorption is negative at -1.6M SF, and vacancy has climbed to 6.3%, though still below the U.S. average. Demand for modern space remains strong, with post-2015 buildings 96% leased, but absorption of newer facilities has cooled. Rents, up 22% in three years, are now moderating, with annual gains slowing to 2.4% as softer demand shifts leverage toward tenants.

Miami remains a critical logistics hub, supported by its 6.1M residents, international trade through its airport and seaport, and limited development capacity due to the Everglades. These supply constraints should keep vacancies relatively low and support rent growth reacceleration by 2026. Investment is holding firm, with $2.6B in 2023 sales above the 10-year average, led by major institutional buyers.

Market indicators

Miami industrial market vacancy rate indicator

Vacancy Rate

6.3%

Icon representing an individual industrial submarket area in Miami commercial real estate

12 Mo Net Absorption SF

-1.6M

Industrial properties under construction square footage icon

Under Construction SF

4.8M

Industrial market rent NNN per square foot indicator

Market Rent Price NNN / PSF

$20.90

Industrial property sale price per square foot icon

Market Sale Price / PSF

$252

Total industrial inventory square footage across Miami submarkets

Total Inventory SF

280M

Market indicators

Miami-Dade gained $9.5B in wealth between 2020–2022, driven by affluent migration and office job growth, boosting retail sales but pushing housing costs sharply higher. By 2025, shelter inflation has slowed to 3%, aided by new supply and cooling demand, while real wages are rising again. Yet nearly 50% of households face affordability challenges, with a deficit of 116,000 affordable units projected by 2030. Despite these pressures, Miami continues to attract high-paying firms like Apple and JPMorgan, sustaining inflows of higher-income residents.
Demographic Overview
Demographic Category Metro US
Population 2,859,545 342,152,563
Households 1,052,483 134,528,000
Median Households $75,360 $81,359
Income 1,445,643 170,831,359
Labor Force Unemployment 2.6% 4.2%

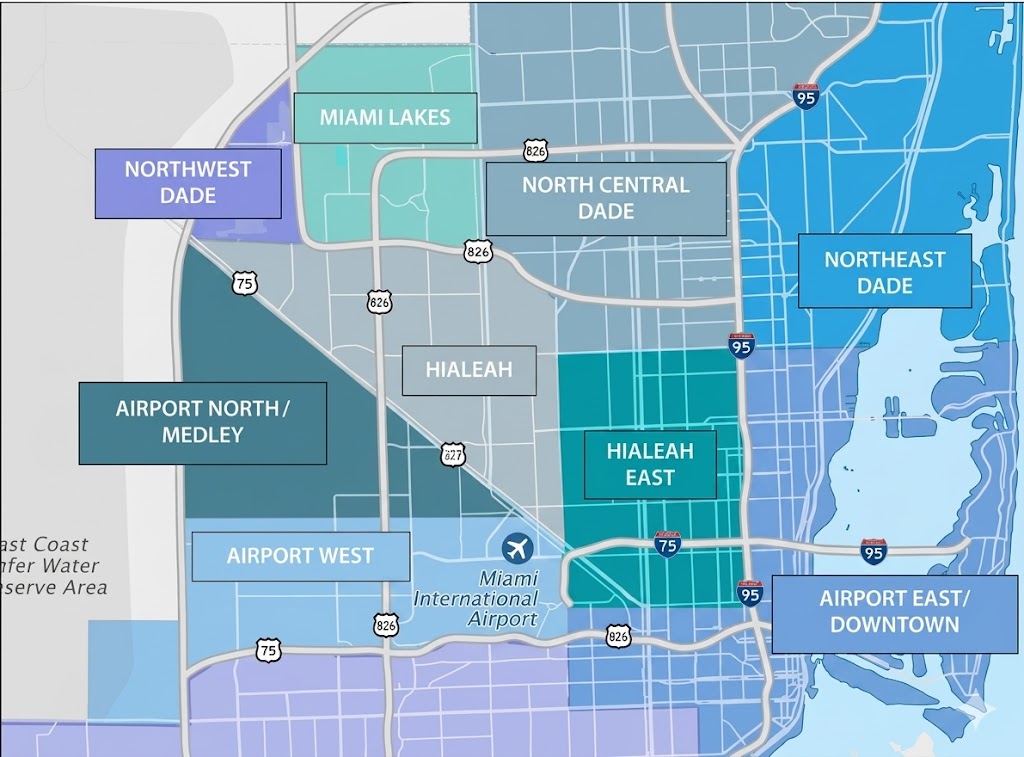
Notable Submarkets - Statistical Data

Notable Submarkets - Statistical Data
Bldgs SF (000) Market % Under Construction SF (000) Market Rent NNN / PSF Vacancy %
Miami Airport West 1,211 49,302 17.7% 2,799 $23.47 5.2%
Miami Airport East 531 22,611 8.1% 140 $21.46 6.3%
N. Miami Beach 1,137 44,824 16.1% 310 $18.63 10.0%
Medley 996 41,663 14.9% 690 $19.49 7.9%
Hialeah 1,686 31,664 11.3% - $15.69 4.6%
Notable Lease Transactions
Notable Lease Transactions Size SF Tenant Deal Type
11390 W 43rd Ave 72,000 Asian Food Distributor New Lease
6501 NW 37th Ave 53,060 Biscayne Bedding New Lease
2301 NW 107th Ave 44,000 Beauty & Logistics New Lease
Notable Sales Transactions
Notable Sales Transactions Size SF Buyer Sale Price
16300 NW 97th Ave 171,178 Martinez Distributors $52,894,000 (309 PSF)
3151 NW 125th St 96,585 Easton Group $16.9M (175 PSF)
15201 NW 34th Ave 52,640 MIG Real Estate $8.14M (155 PSF)

Source: Costar.com. The information contained within this report is believed to be reliable. The information may contain errors or omissions and is presented without any warranty or representations as to its accuracy.