Q4 2024 Miami Dade County, FL

Industrial Market Overview

Over the past year, Miami’s industrial net absorption dropped to -210,000 SF, well below the pre-pandemic average of 3.1 million SF, as major tenants vacated large spaces, pushing the vacancy rate from 2.0% in 2022 to 5.3% by Q4 2024. Despite the slowdown, vacancy rates remain below the U.S. average, with limited available space driving demand. Modern logistics properties are 96% leased, enabling landlords to raise rents by 32.5% over the past three years, though rent growth has slowed to 2.8%. Geographic constraints like the Everglades help keep vacancy rates low, supporting future rent growth by 2025–2026. Miami’s industrial market remains vital for logistics, bolstered by Miami International Airport and the Port of Miami. Sales activity slowed in 2023 due to rising interest rates but picked up in late 2023 with major acquisitions by prominent buyers.

Market indicators

Miami industrial market vacancy rate indicator

Vacancy Rate

5.3%

Icon representing an individual industrial submarket area in Miami commercial real estate

12 Mo Net Absorption SF

-347K

Industrial properties under construction square footage icon

Under Construction SF

3.7M

Industrial market rent NNN per square foot indicator

Market Rent Price NNN / PSF

$20.45

Industrial property sale price per square foot icon

Market Sale Price / PSF

$238

Total industrial inventory square footage across Miami submarkets

Total Inventory SF

276M

Market indicators

Between 2020–22, Miami-Dade County gained $9.5 billion net inflow of wealth, driven by high-income migration and job growth. While this boosted retail sales and economic activity, it also raised living costs, with home prices up 70% and rents seeing double-digit increases since 2020. Inflation has moderated, and real wages are improving, but high costs continue to impact lower-income residents, driving many to leave for more affordable areas. The county needs 116,000 affordable housing units by 2030, but most development has been luxury apartments. While Miami continues to attract high-paying firms, most upcoming job growth is in lower-wage sectors, increasing pressure on affordable housing.
Demographic Overview
Demographic Category Metro US
Population 2,716,272 337,183,531
Households 1,000,175 132,454,922
Median Households Income $71,214 $78,358
Labor Force 1,405,863 168,804,453
Unemployment 2.1% 4.2%

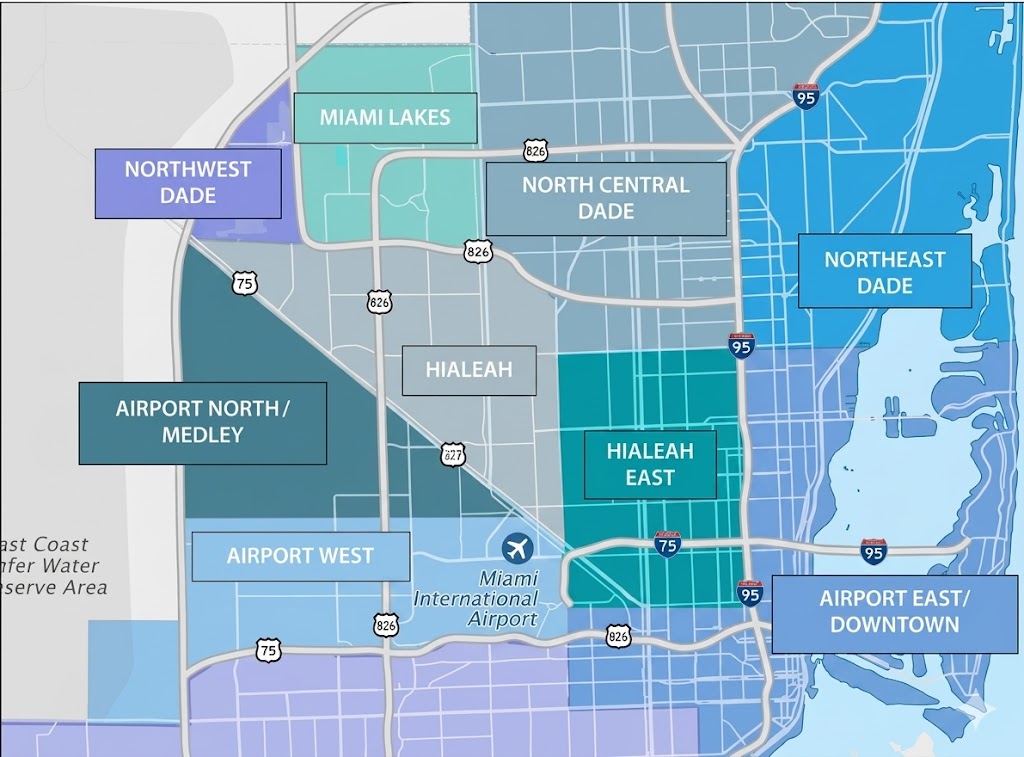
Notable Submarkets - Statistical Data

Notable Submarkets - Statistical Data
Bldgs SF (000) Market % Under Construction SF (000) Market Rent NNN / PSF Vacancy %
Miami Airport West 1,191 48,445 17.4% 371 $22.84 4.2%
Miami Airport East 534 22,587 8.1% - $20.66 3.3%
N. Miami Beach 1,134 44,126 15.9% 1,234 $17.85 7.1%
Medley 991 41,491 14.9% 506 $18.72 4.1%
Hialeah 1,677 31,703 11.4% - $14.94 4.0%
Notable Lease Transactions
Notable Lease Transactions Size SF Tenant Deal Type
11250 W 36th Ave, Hialeah, FL 95,356 Cooper & Hunter New Lease
3075 NW 107th Ave, Doral, FL 81,898 UniUni Logistics New Lease
1400 NW 159th St, Miami, FL 69,825 Global Furniture Renewal
Notable Sales Transactions
Notable Sales Transactions Size SF Buyer Sale Price
14100 NW 60th Ave, Miami Lakes, FL 190,707 Ali Ahmed $38,250,000 ($200 PSF)
7600 NW 82nd Pl, Miami, FL 178,428 BGO $60,000,000 ($336 PSF)
1401 NW 78th Ave, Miami, FL 74,786 EQT Exeter $20,600,000 ($275 PSF)

Source: Costar.com. The information contained within this report is believed to be reliable. The information may contain errors or omissions and is presented without any warranty or representations as to its accuracy.