Q4 2023 Miami Dade County, FL

Industrial Market Overview

Miami’s industrial market remains a crucial logistics hub despite slower economic growth. While tenant demand has cooled and vacancies increased slightly, limited existing space, and continued new construction kept vacancies well below the national average. Rents are still rising, though at a more moderate pace, thanks to tight market conditions. Access to a large population, Miami International Airport, and the Port of Miami attract both local and international players, driving competition for space and keeping market fundamentals strong. Sales volume and transaction sizes contracted significantly due to rising interest rates, but cap rates remain attractive, especially for well-located and modern properties. Overall, Miami’s industrial market is well-positioned for continued growth despite near-term challenges.

Market indicators

Miami industrial market vacancy rate indicator

Vacancy Rate

3.2%

Icon representing an individual industrial submarket area in Miami commercial real estate

12 Mo Net Absorption SF

1.5M

Industrial properties under construction square footage icon

Under Construction SF

7.37M

Industrial market rent NNN per square foot indicator

Market Rent Price NNN / PSF

$20.11

Industrial property sale price per square foot icon

Market Sale Price / PSF

$254.78

Total industrial inventory square footage across Miami submarkets

Total Inventory SF

224M

Market indicators

Miami-Dade County experienced a return in population growth after a two-year decline, with a notable influx of high-wealth individuals contributing over $6.4 billion in new wealth in 2021. Despite challenges in affordability for the average worker, Miami’s real retail sales and job growth exceeded national averages. The city’s GDP growth outperformed the U.S., led by sectors like finance and insurance. Miami attracted notable financial firms during the pandemic, while its tech sector faced challenges. Office-using sectors, including professional services, continued to thrive. Although tourism hasn’t fully recovered, Miami’s startup ecosystem has flourished, ranking 31st globally and attracting substantial venture capital funding, positioning the city as a growing hub for startups.
Demographic Overview
Demographic Category Metro US
Population 2,702,634 335,185,875
Households 988,642 130,872,977
Median Households Income $67,767 $76,274
Labor Force 1,386,056 167,600,859
Unemployment 1.8% 3.6%

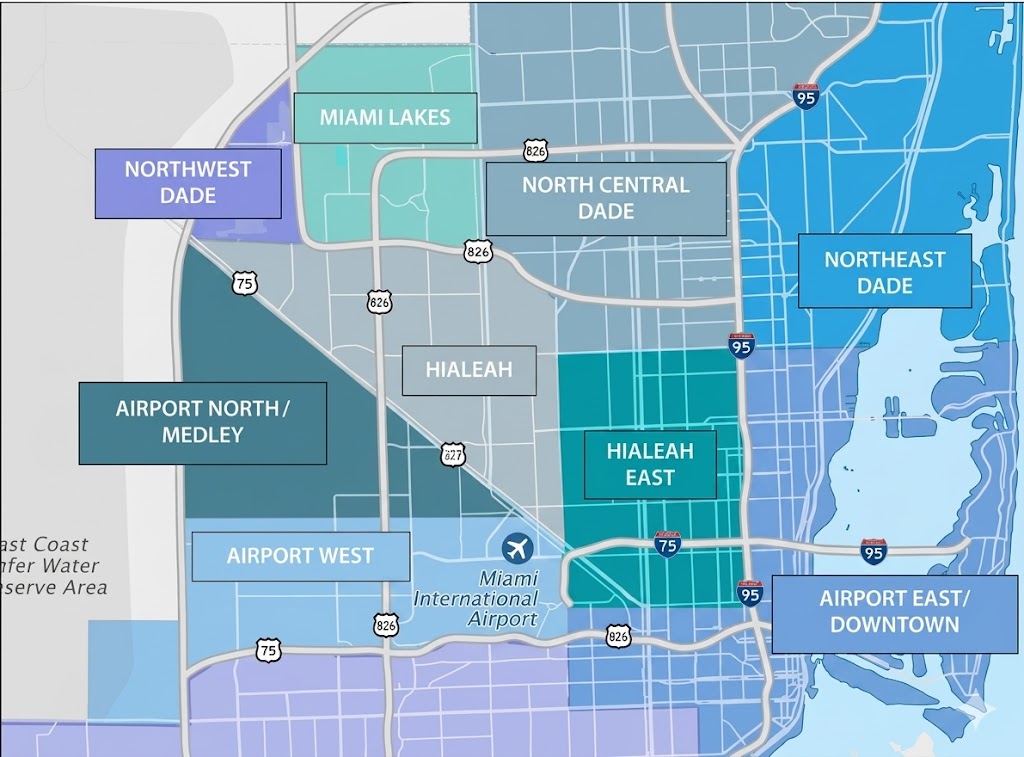
Notable Submarkets - Statistical Data

Notable Submarkets - Statistical Data
Bldgs SF (000) Market % Under Construction SF (000) Market Rent NNN / PSF Vacancy %
Miami Airport West 1,182 49,318 18.1% 1,358 $22.61 4.4%
Miami Airport East 525 22,300 8.2% - $20.61 2.5%
N. Miami Beach 1,130 42,520 15.6% 1,763 $17.85 3.8%
Medley 988 41,537 15.2% 924 $18.74 1.9%
Hialeah 1,673 31,598 11.6% 25 $14.76 3.0%
Notable Lease Transactions
Notable Lease Transactions Size SF Tenant Deal Type
8501 NW 80th St, Medley, FL 257,074 Nestle Renewal
6905-6909 NW 25th St, Miami, FL 145,855 The Queen's Flowers Corp New Lease
21301 NW 47th Ave, North Miami Beach, FL 397,167 Iberia Foods New Lease
Notable Sales Transactions
Notable Sales Transactions Size SF Buyer Sale Price
Beacon Logistics Park, 4120-4221 W 91st Pl, Hialeah, FL 1,087,957 Property Reserve $174,340,000 ($160 PSF)
Bridge Point Cold Logistics Center, 8855 NW 35th Ln, Doral, FL 312,103 Ponte Gadea USA, Inc. $113,000,000 ($362 PSF)
Longpoint Partners Portfolio (11 of 25 properties) 786,423 Longpoint Partners $104,785,103 ($133 PSF)

Source: Costar.com. The information contained within this report is believed to be reliable. The information may contain errors or omissions and is presented without any warranty or representations as to its accuracy.